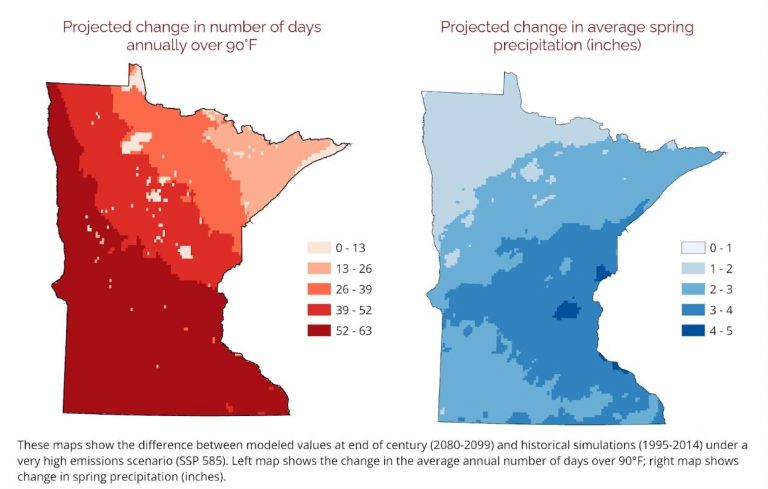
The above maps use MN CliMAT data to compare historical simulations (1995-2014) with modeled values at the end of the century (2080-2099) under a very high emissions scenario (SSP585; see page 12) to show the change in the average annual days over 90 degrees Fahrenheit (left) and inches of spring precipitation (right).
University of Minnesota Extension MN CliMAT allows the public and professionals to see how even specific towns throughout the state may be impacted in the…