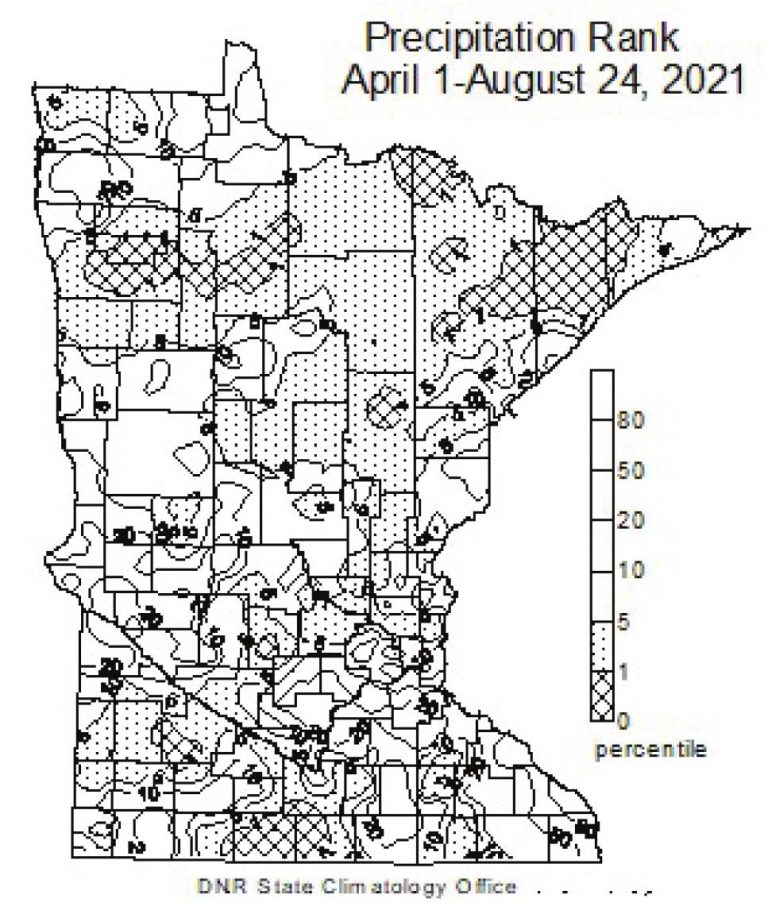
This map depicts the precipitation ranking for April 1-August 24, 2021 compared to the period of record. Historical ranking maps depict annual precipitation totals as they rank when compared to annual totals over the modern record. The values presented are percentiles. A ranking near zero indicates the year was drier than any found during the period of record. A ranking near 100 designates that the year was wetter than any found on record. A ranking of 50 is equivalent to the “median”, a measure of central tendency. Photo Submitted
Yellow Medicine Soil & Water Conservation District The weather. It always seems to give us something to talk about. Dedicated volunteer observers state-wide not only…